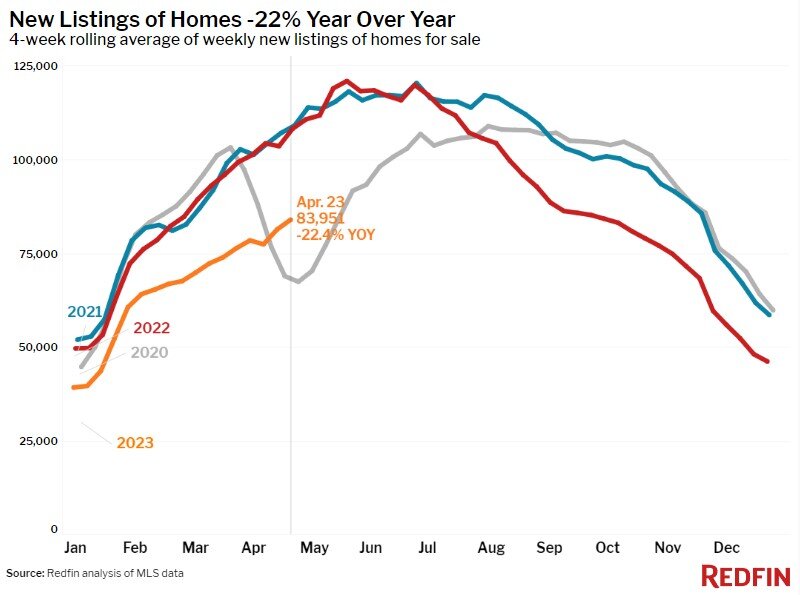
According to national property broker Redfin, new listings of homes for sale fell 22.4% nationwide from a year earlier during the four weeks ending April 23, 2023, one of the biggest declines since the start of the pandemic.
Homeowners are staying put because they want to hang onto their low mortgage rates–this week’s average 30-year mortgage rate increased for the second week in a row–and because it’s hard for them to find another home to buy. The lack of new listings is driving an unseasonal decline in the total number of homes for sale.
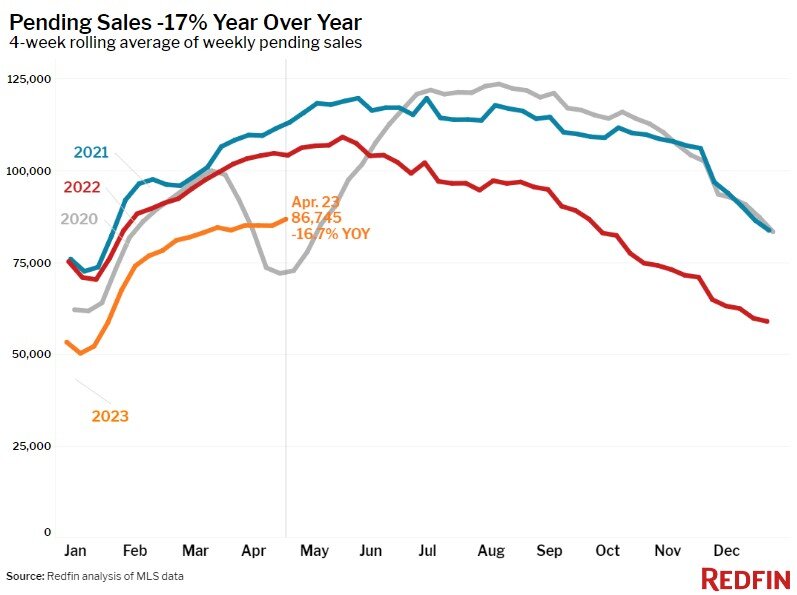
The dearth of inventory is also making some homes sell quickly. Nearly half of homes on the market are selling within two weeks, the highest portion in nearly a year. The share has increased throughout April, atypical for this part of the year. That’s in spite of elevated mortgage rates keeping some buyers on the sidelines, with pending home sales down 17% year over year.
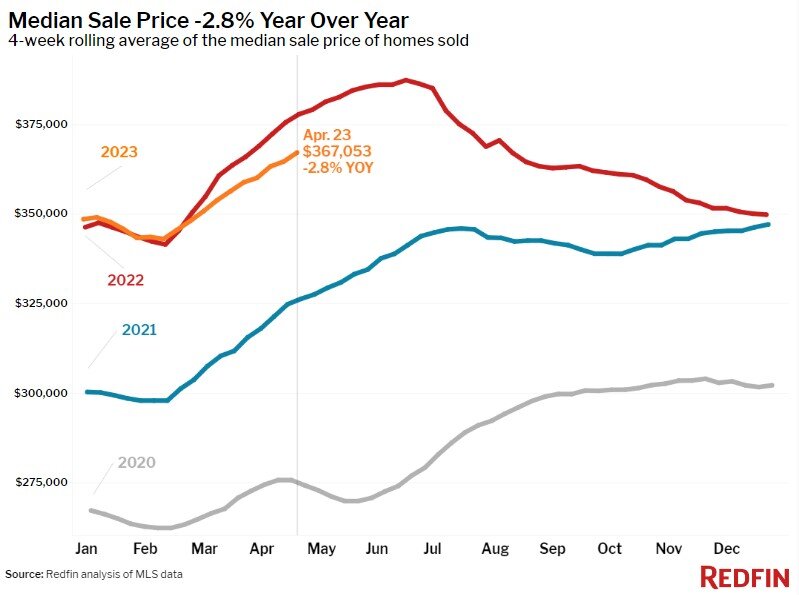
Buyers are battling for the few homes on the market, keeping home prices from falling more. The U.S. median sale price is down 2.8% year over year, similar to the price declines we’ve seen over the last month. Prices are falling more in some parts of the country and increasing in others; they’re down most in Austin, TX (-13.7% YoY), Oakland, CA (-13.5%) and San Francisco (-12.3%).
“High mortgage rates have caused some homebuyers to bow out of the market. But there are still more people looking for a home than there are homes for sale,” said Redfin Deputy Chief Economist Taylor Marr. “That’s good news for the homeowners who want or need to sell their home now. In certain parts of the country where new listings are especially rare, sellers who price their homes in line with the market are attracting multiple offers. Propped-up home prices and values also bode well for the future of the housing market because they may eventually lure more prospective sellers off the sidelines.”
Phoenix Redfin agent Heather Mahmood-Corley said demand is outpacing supply in her area. “New listings have slowed over the last few weeks and buyers are clamoring for the homes that do come on the market,” she said. “Nice, well-priced homes are getting multiple offers. I showed a home to a buyer last weekend and we had to wait in line because there were so many prospective buyers there. It was the first time in a year I’ve had to wait in line to see a house.”
In Seattle, prices and pending sales have both declined more than the national average. But local Redfin agent Shoshana Godwin said she’s noticing an uptick in demand this month. “Some buyers are hoping to get a deal because mortgage rates are high, but prices for desirable homes are actually going up because there’s such limited inventory,” Godwin said. “I’m telling buyers that prices may rise from here because inventory will remain tight as long as interest rates are high. Those who can afford to should consider buying now if they’re lucky enough to find a home they want.”
Leading indicators of homebuying activity:
- For the week ending April 27, average 30-year fixed mortgage rates inched up to 6.43%, the second-straight small increase after five straight weeks of declines. The daily average was 6.67% on April 27.
- Mortgage-purchase applications during the week ending April 21 increased 5% from a week earlier, seasonally adjusted. Purchase applications were down 28% from a year earlier.
- The seasonally adjusted Redfin Homebuyer Demand Index–a measure of requests for home tours and other homebuying services from Redfin agents–was down slightly from a week earlier during the week ending April 23, but up 3% from a month earlier . It was down 13% from a year earlier.
- Google searches for “homes for sale” were down about 8% from a month earlier during the week ending April 22, and down about 20% from a year earlier.
- Touring activity as of April 22 was up about 28% from the start of the year, compared with a 17% increase at the same time last year, according to home tour technology company ShowingTime.
Key housing market takeaways as of mid-April 2023:
- The median home sale price was $367,053, down 2.8% from a year earlier. That’s the ninth-straight four-week period of declining sale prices.
- Home-sale prices declined in 29 of the 50 most populous U.S. metros, with the biggest drop in Austin, TX (-13.7% YoY). It’s followed by Oakland, CA (-13.5%), San Francisco (-12.3%), Anaheim, CA (-10%) and Sacramento, CA (-9.4%).
- Sale prices increased most in Fort Lauderdale, FL, where they rose 10% year over year. Next come Miami (8.7%), Cleveland (7.9%), Cincinnati (7.5%) and Columbus, OH (7%).
- The median asking price of newly listed homes was $394,375, up 0.2% year over year.
- The monthly mortgage payment on the median-asking-price home was $2,555 at a 6.43% mortgage rate, the current weekly average. That’s an all-time high and up 12% ($271) from a year ago.
- Pending home sales were down 16.7% year over year.
- Pending home sales fell in all 50 of the most populous U.S. metros. They declined most in Las Vegas (-39%), Seattle (-38.9%), Portland, OR (-38.7%), Chicago (-36.9%) and Oakland, CA (-36.2%).
- New listings of homes for sale fell 22.4% year over year.
- New listings declined in all 50 of the most populous U.S. metros. They dropped most in Oakland (-43.3% YoY), San Diego (-39.8%), Seattle (-39.6%), Sacramento (-39.2%) and Riverside, CA (-38.2%).
- Active listings (the number of homes listed for sale at any point during the period) were up 7.4% from a year earlier, the smallest increase in nine months. This metric posted an unseasonal decline.
- Months of supply–a measure of the balance between supply and demand, calculated by the number of months it would take for the current inventory to sell at the current sales pace–was 2.7 months, up from 1.9 months a year earlier. Four to five months of supply is considered balanced, with a lower number indicating seller’s market conditions.
- 47% of homes that went under contract had an accepted offer within the first two weeks on the market, the highest level in nearly a year.
- Homes that sold were on the market for a median of 34 days, the shortest span since October. That’s up from 20 days a year earlier and the record low of 18 days set last May.
- 30% of homes sold above their final list price, the highest share in six months but down from 53% a year earlier.
- On average, 5% of homes for sale each week had a price drop, up from 2.6% a year earlier.
- The average sale-to-list price ratio, which measures how close homes are selling to their final asking prices, was 99.1%, the highest level in six months but down from 102.4% a year earlier.


